Crazy Egg – A Review of a Heat Map Tool
This article is not only a review of Crazy Egg, a heat map tool, we are also giving away a lifetime license and the opportunity to test Crazy Egg 60 days for free. In case you haven’t heard of Crazy Egg before, it’s a tool that generates a heat map and a scroll map based on the click behavior of your visitors.
As said, I’m giving away a lifetime license to one of my readers. For those who didn’t win, there is a special link that will give you a free trial for up to 60 days. You will find all the necessary info about this competition underneath the review.
Editorial side note: This is a paid review. Regardless of the amount paid, the review is my own honest and true opinion of the tool, be it positive or negative.
Crazy Egg: Before and now
I was able to test Crazy Egg a long time ago when I wrote a little piece about heat map systems. Although I initially liked the tool (heat maps were rather new back then), I didn’t have enough traffic to really give it a good test run. Since then, traffic has increased so it was time to give it another try.
I have to say that a lot of features have been changed, added or taken out from Crazy Egg since my last test run. Integrating mobile and tablet screenshots, a feature to compare heat maps or tracking visitors by using your own defined goals are just a few of them. More on that later.
Implementation of Crazy Egg
The first thing I noticed when going through the setup is how easy it was to enable Crazy Egg. All I had to do was to insert a little asynchronous script (the Crazy Egg tracking code) in the footer of the pages I wanted to track. Crazy Egg notified when they retrieved the little snippet and if everything was working. They even offer you a plugin, if you’re running your website with WordPress.
How does it work
Crazy Egg takes a screenshot from specified URL, collects all clicks on that page and projects it as a heat map on top of the screenshot. With every measured mouse click, valuable data such as the referrer, country, device type, etc are added to that single click. They also offer maps other than a heat map, such as a scroll, the confetti and the overlay map. I’m discussing them one by one in this review.
Setting up your first snapshot
Using Crazy Egg is pretty straightforward. Adding a snapshot is done in less than a minute. Enter the url of the page you want to track, add a description if you’d like and choose the device which will be used to take the screenshot (desktop, tablet or mobile). You can also track people who are using a certain device, which comes in handy if you’re only interested in the mobile users.
If you select all traffic from all devices, you can actually compare the mobile with the desktop heat map in a later stage.
The advanced options give you the possibility, among others, of using regular expressions. Tracking all product pages belonging to a certain product category is now very easy (as long as your url structure permits this).
The last option is the duration of tracking, which can be set to an amount of visitors or days.
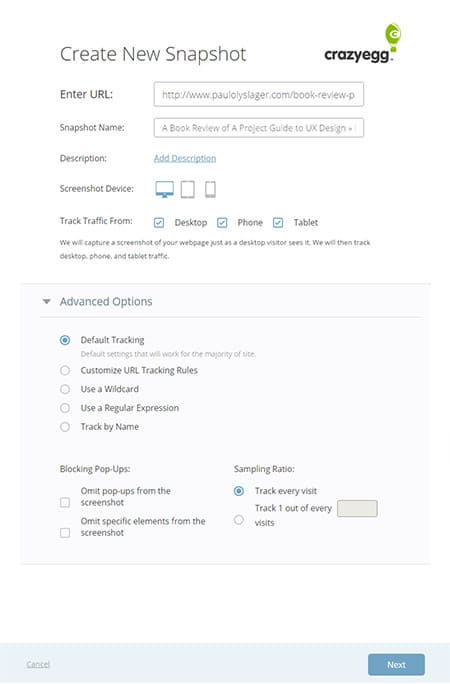
Setting up your first snapshot.
Reports by Crazy Egg
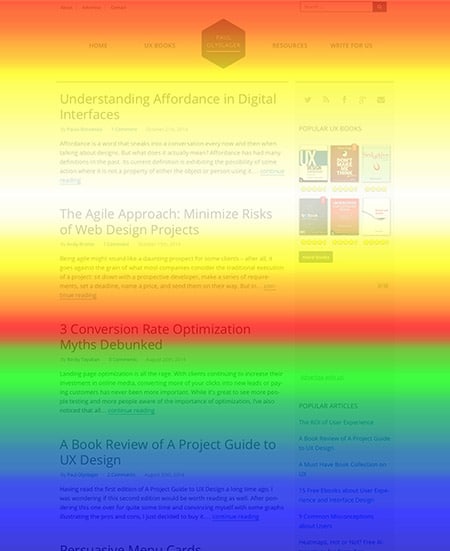
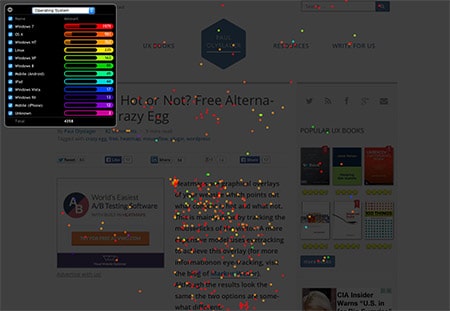
Heat map
Let me start of with the most popular one, the heat map. This generated heat map report is based on actual clicks of your visitors and gives you an understanding of how they engage with your website.
A part of a heat map on one of my articles.
As you can see, parts that get many clicks start to glow, meaning popular click area’s. Behind every click lies a huge amount of information, which you can consult on the confetti map (later more on that).
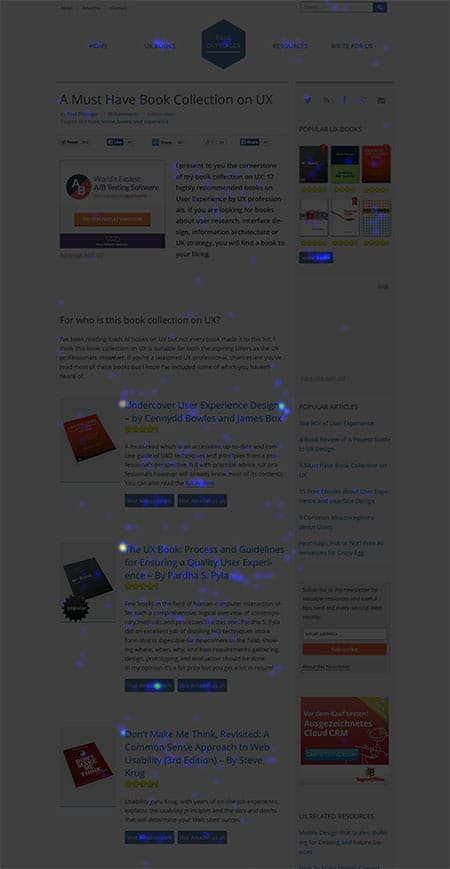
Scroll map
The scroll map is a visual representation of the amount of time that visitors spend viewing certain sections of your page. By using this information, you can re-prioritize your important content to more popular page sections. It allows you to compare scroll maps side by side, such as a mobile and a desktop version.
Scroll map of my homepage by Crazy Egg.
Overlay
The overlay is to my experience less useful than the other generated maps. This overlay comes with a collection of little colored markers, attached to every section which were clicked. You can open the marker to retrieve more information about that particular part. Blue means less clicks in regard to the overall amount of clicks on that page and you can guess what the red markers means.
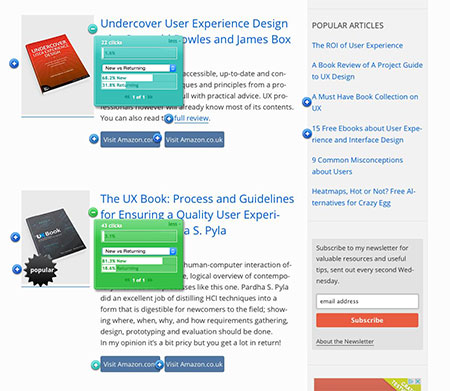
The overlay map uses coloured markers to visualise the popular sections in regard to the overall clicks on that page.
As said, I believe that the overlay map doesn’t give me any additional useful information, compared to the already mentioned maps. But the next one does!
Confetti
The confetti report shows some similarities with the heat map. The confetti overlay is a map visualising the most popular sections according to clicks, but this report dives even deeper, a lot deeper. Every single click holds a ton of information, categorised by browser, country, used devices, referrals, … Dots or clicks belonging to the same category have the same color.
If you would like to know where all Chrome users clicked on, you only need to select the browser category. You’ll receive a list of all clicks categorised per browsers, in which you can filter the Chrome users.
The confetti allows you to dive deeper behind every click.
On top of that, you can now define your own variables. With some little javascript you can categorize the clicks any way you like it, giving you endless possibilities. For example, you can track users who are logged in or categorize them by the number of previous clicks they made on the page.
How to make it actionable
So how can a heat map help you in decision making which ultimately should lead to conversion optimization? How can you make these results “actionable”? As with many good digital analytic tools, such as Google Analytics for example, results reveal insights used to create hypothesis on how to improve conversions.
I will give you one example. A while ago, Vanissa Wanick wrote an article titled “UX Designers Can Learn From Game Design and Gamification“. Although I believe it was a great article with some very interesting facts, the scroll map was showing that the majority of visitors stopped reading half way through the article.
Not only does this article deserve much better, we also have extra content underneath the article, such as the related articles and the comments section, which we would like to share with to our readers.
We came to several hypothesis and one of them was that the article didn’t contain enough images. Images are perfect in explaining something visually when text doesn’t suffice but also to create some variation in the reading experience.
We republished the article after adding some well-chosen images and started tracking again with Crazy Egg’s scroll map. The results were amazing. Not only did people finish reading the article, we saw an increase of 12% of clicks on the related articles as well.
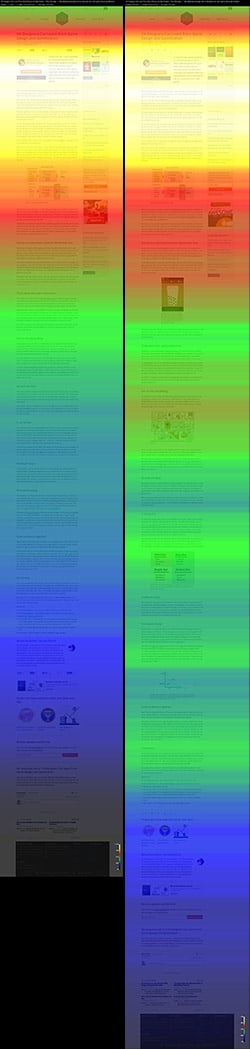
On the left you see the original. On the right we have added some images. As you can see people scroll more to the bottom and read the entire article although the page being longer.
Conclusion
A while ago I wrote an article about the alternatives of Crazy Egg, but in all fairness I really believe that Crazy Egg is still on of the best heat map tools out there. What really made the difference for me was the possibility of defining your own categories and goals, giving this tool that extra boost.
Competition
As said before, we are giving away one lifetime license to one of our readers. For those unlucky ones who didn’t win, Crazy Egg is offering my readers a free 60 days trial so you can test it out yourself.
The lifetime license
Would you like to win a lifetime license of Crazy Egg? We would love to hear your story. Have you been using heat maps, what did you track, whit what kind of hypothesis did you come up with and what were your results? If you haven’t used heat maps before, let us know how you are going to use it, your expectations of the tools, what you would like to improve and how heat maps can help you achieving this goal.
So leave a comment with your story! The winner will be selected and notified on the 16th of January 2015. Good luck!
The 60 day free trial
Besides the full lifetime license we are also giving you the opportunity to test Crazy Egg for 60 days, totally free. All you need to do is follow the link below and subscribe with your email address. Enjoy and let me know how it worked out for you!


Paul, leuke tool! ga ik zeker eens bekijken, alleen jammer dat ze ook voor de trial een credit card nodig hebben… groetjes, Koen
Hi Paul fun way to generate interaction! I am a Director of Marketing for a firm in SoCal and I think HeatMaps are a form of visual intelligence that can help inform in visual ways way more streamlined than google analytics can. I am not using heat maps currently but we are looking into it. For me, I would find out where my holes are on my homepage, landing pages (button placement, size, links, CTAs, etc) signup page, other critical pages and make better decisions on how to drive sales better on my site. a cheap way to hire UX
On homepage, I would change placement of my buttons if i notice they never get action or remove ones that aren’t getting clicked on. After noticing how much action i’m getting around my sign up button I might increase size or place it in multiple areas that show more clicks. On my features page, i would see how much activity im getting and immediately know areas of interest and promote those strong on homepage, in ads, blog, collateral. I would increase visibility (pixel size) of features that are getting more action. It would help me eliminate clutter and know what features are really compelling and i could notice trends, seasonal, etc and promote those better. On New LO Site for agents I might place video above the fold bcuz i might realize with the scroll map tool that 30% of visitors people don’t look down that far or my overlay tool would show me how many are clicking on it or which tiles are being clicked on or not clicked on so i know how to market better to my customers
there’s my take! I hope i win! :)
Hi Paul
I am Head of UX at Madgex (Job board solutions) and we are looking at how we can use HeatMaps at the moment as a part of our continuous improvement plan, particularly how they can help us to optimise conversions. We’re very interested in learning more about how people use mobile devices in comparison to desktop. We have various home page themes on our job boards and I’d really like to look at the behaviour across these.
Hey Paul,
I find heatmaps offer great insight into page interaction, highlight content that could be distracting or confusing visitors and show the effectiveness of call to actions. However they don’t tell you why certain elements are being clicked. Heatmaps can be used to create a hypthoses, which you can then test (preferable with an A/B split test) to prove your hypthoses, similar to how you did in the ‘UX Designers Can Learn From Game Design and Gamification’ example.
I find a good way to start is to create a document with a few bits of manual analysis of the page, before studing the heatmap. Identify what you beliveve to be weak points, which are primary CTA’s, which areas might be distracting and which elements you expect to be clicked and which elements you wouldn’t want visitors clicking.
After comparing the heatmap back to the original document, are the primary CTAs getting the most clicks, are the elments you thought might be a distraction actually getting clicks or being ignored? You can now create multiple hypthoses to test. Before testing, rank the hyptheses in order of which would provide the biggest conversion lift and go from there.
Hi Scott, thank you for sharing this with all of us. Great insights! On top of that, you are the winner of the lifetime license of Crazy Egg. All I would need is your email address. If you could send it over, I’ll make sure that your account is set up.
Cheers Paul, looking forward to getting stuck in with further heatmapping action… scott @ lordsewing.co.uk (without the spaces) cheers!!!
Hey
I am an amateur website developer with my eCommerce website http://www.saledart.com. We had a low traffic of just 100-200 visitors daily. But then i started paying for ads and promoting my website, i have facebook ads and google ads working for me.
What i came across is that i have 100 new clicks from facebook each day, but i have no clue what they do on my website, i mean my order/conversion rate is still the same. My main motive is not website traffic i want SALES. So i wanted to know what is that exactly people do on my website.
I came across mouseflow but i was looking for alternatives before starting, then i came across your post. For Free Crazy Egg Alternatives :D :D. before that i started testing http://abtoanalytics.com/ they are free for now (WOW) since they are in beta.
But i want the best in the business which right now is crazyegg but i am kindof a person who sees cost vs benefit, until i am sure that i can make more money than i am paying to crazyegg i wont be buying their plans.
Now a little buttering for you :D
Really Loved the way you written the review specially when u explicitly mention it is a paid review, since if people get to know this from outside they tend to JUDGE. It was really helpful for me to decide what to do next.
Keep up the Goodwork.
Cheers
Angad Arora
Nice succinct but detailed review. I briefly tried Crazy Egg a few years back and your article has highlighted a number of great features I didn’t know it had. I’d add that their blog is an excellent source of information about conversion optimisation and UX.
I’m part of a very small UX team in Cape Town and due to budget constraints we opted to use Mouseflow for user tracking because you’re able to watch user recordings. The problem is that the heatmaps it generates aren’t as detailed and data rich as Crazy Egg. We’d love to use both side by side to augment our current analysis activities.
Scott has a good approach to analysis of heatmaps. What I take from his advice is that it’s as important to know where people are clicking as it is to know where they aren’t.
I’d love to give Crazy Egg another go especially since it works across devices. I’m most excited about the confetti view and the ability to get detailed info by browser. Look amazing thanks for the review.
The competition for the lifetime license of Crazy Egg has come to an end. I would like to thank everyone for participating and sharing your experience and ideas! The innocent hand of my beloved colleague (read: random number generator) has chosen Scott as the winner! Congratulations!
For those who didn’t win, don’t you worry, I’m already setting up the next competition!
The winner will be selected and notified on the 16th of January 2015. Oh rats. I thought it said 2016. Pooh Bear! lol
Sorry about that SunShine. But don’t you worry, we have more contests coming up!
Well, i think i came too late for the contest :( hahahaha
Thank you anyway for the description about crazyegg! i want to give it a try!
Hi Daniel, I guess you are too late, sorry about that :). Let us know how Crazy Egg worked out for you!