The Art of a Good Customer Journey Map
I’m a big advocate of story telling. I think it dates back to when I was a kid – enjoying watching Disney films of old up to, and including, the rise of animation in the 90’s all the way through to the rendered computer animation craft of Pixar. We can learn a lot from stories – specifically related to the human psyche.
And to take the powers of story telling and apply it to business can be a powerful thing. Think about it; crafting a story, or stories, for your users to follow, you can create, manipulate and influence users that can help both improve their user experience and your margins.
“This is what a customer journey map provides: a story, or multiple stories, on how the customer interacts, or should interact, with your company.”
Pre-text: a note that there are a million and one ways to approach a customer journey map, both in research, output, process and presentation. This is just based on my experience but there are certainly patterns and identifiable consistencies across the board.
The purpose of a customer journey map
First we must understand the purpose of a customer journey map and what the specific objectives are for your business. A customer journey map, by all intents and purposes, is a story of how a user interacts and engages with your brand. Specifically focusing on online, it indicates the initial contact points, the engagement factors and from there we can indicate how to leverage this information to persuade the user to convert.
Ideally, it should include the following:
- Personas
- A timeline
- Feelings of your users
- Touch points
- Channels
There can be varying levels of objectives for creating such maps; be they tactical (“I need to persuade users to purchase other items whilst at the basket level”) to strategic (“We need to better understand our users for offline marketing purposes”). In my job, I’m often simply required to determine if our users are achieving their goals, and if not, how can we persuade them to do so? In essence, we need to leverage the pitfalls and take advantage of the opportunities to help increase conversion rates.
The research
There is such a thing as data paralysis, but the general rule of thumb is that the more data the better; both qualitative and quantitative. I recommend starting off with the quantitative. Paul Boag agrees stating that analytical research is different than anecdotal research. In this case, Google Analytics and the likes are a nice tool to understand large quantities of data and condensing them into segments of insight. Their behavior map is, in effect, a low-level customer journey map [see below].
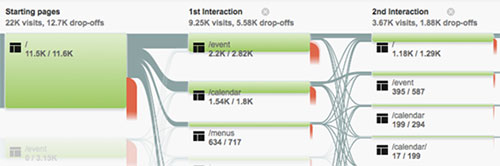
The Behavior Flow Map of Google Analytics.
From there we can validate it with other research methods. User testing is a popular method to understand how users move engage with your site – see UserConversion.com. Heatmaps also indicate popular areas of attention and interaction – see CrazyEgg.com. Lower level behaviour videos of how users are moving round your site (no audio, not task-based) are perhaps the most useful tool for this requirement – for this we can use Decibelinsight.com. There are plenty of data mining technologies and research tools, but that’s for another article another time.
The understanding
Now that we’ve done the research can we start to form a cohesive understanding of what are users are doing and why.
We need to understand the channels and touch points that form a specific action. For example, if the action is ‘buy a tshirt’ the channels in which users will perform that action could vary from organic search, PPC, email or social. The touch points, too, could change between direct internal search to a category of ‘tshirts’ or a category of ‘best sellers’.
At each touch point, we need to understand what HFI call “blocks and motivators”. These are the feelings that either persuade a user to undertake an action or the emotions that prohibit a user from continuing their journey. Examples in this case might be “on trend” as a motivator at the category page when viewed alongside other tshirts, but “price” as a block that prohibits the user from continuing.
The presentation
For me, this is one of the most difficult elements of creating a customer journey map; the presentation of it.
If a customer journey map is a story in it’s lowest common denominator, we need to ask ‘what is the best way to tell a story’? Video? Text? Imagery? More so, we need to consider condensing a lot of data and insight into this story. As a result, an infographic tends work best. What it needs to identify, however, in my opinion is:
- Multiple common and pattern-orientated touch points of a user…
- …set out in a story-based format…
- …identifying their blocks and motivations for moving from one touch-point to the next…
- …backed up by both quantitative and qualitative data
That’s a lot to fit into one diagram. Here are a few examples, for inspiration, to coo over but the presentation of this is important as you might know and understand this back-to-front, but convincing the stakeholders, and interpreting this into insight is what matters most.
“Don’t make it too complex. It is easy to get caught up in the multiple routes a user might take. This will just muddy the story. [It should be] something you could pin to the office wall.”
“There is no set template, and a lot can depend on who the audience for the user journey is. If it is to communicate to developers, they may be happy enough with a purely text based journey. If it is for an executive committee then you may want to think about adding illustrations to each step (think comic book).”
“Get creative with how you lay it out—it doesn’t have to be a standard left to right timeline. It could be circular or helical. It could be one large map or it could be an interactive, clickable piece with embedded video. There are no templates, and there are infinite possibilities.”
Some examples of Customer Journey Maps

The first step of the Mobile Commerce Design process should be to analyze how shoppers of a particular brand (and competitor brands) currently use their mobile devices to support each phase of theshopping cycle. Image by Jonathan Lupo. View larger image

Customer Journey Mapping. Image from Smashing Magazine. View larger image
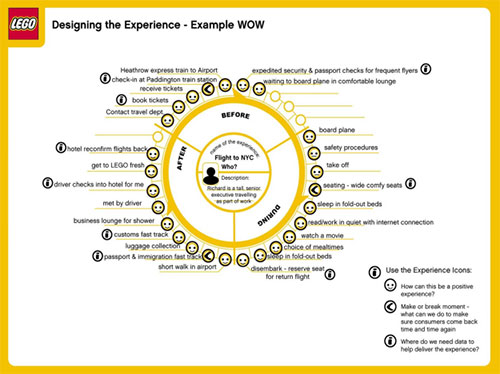
A different way to show a journey – Experience map of an executive visiting Lego. Source: The UX Review
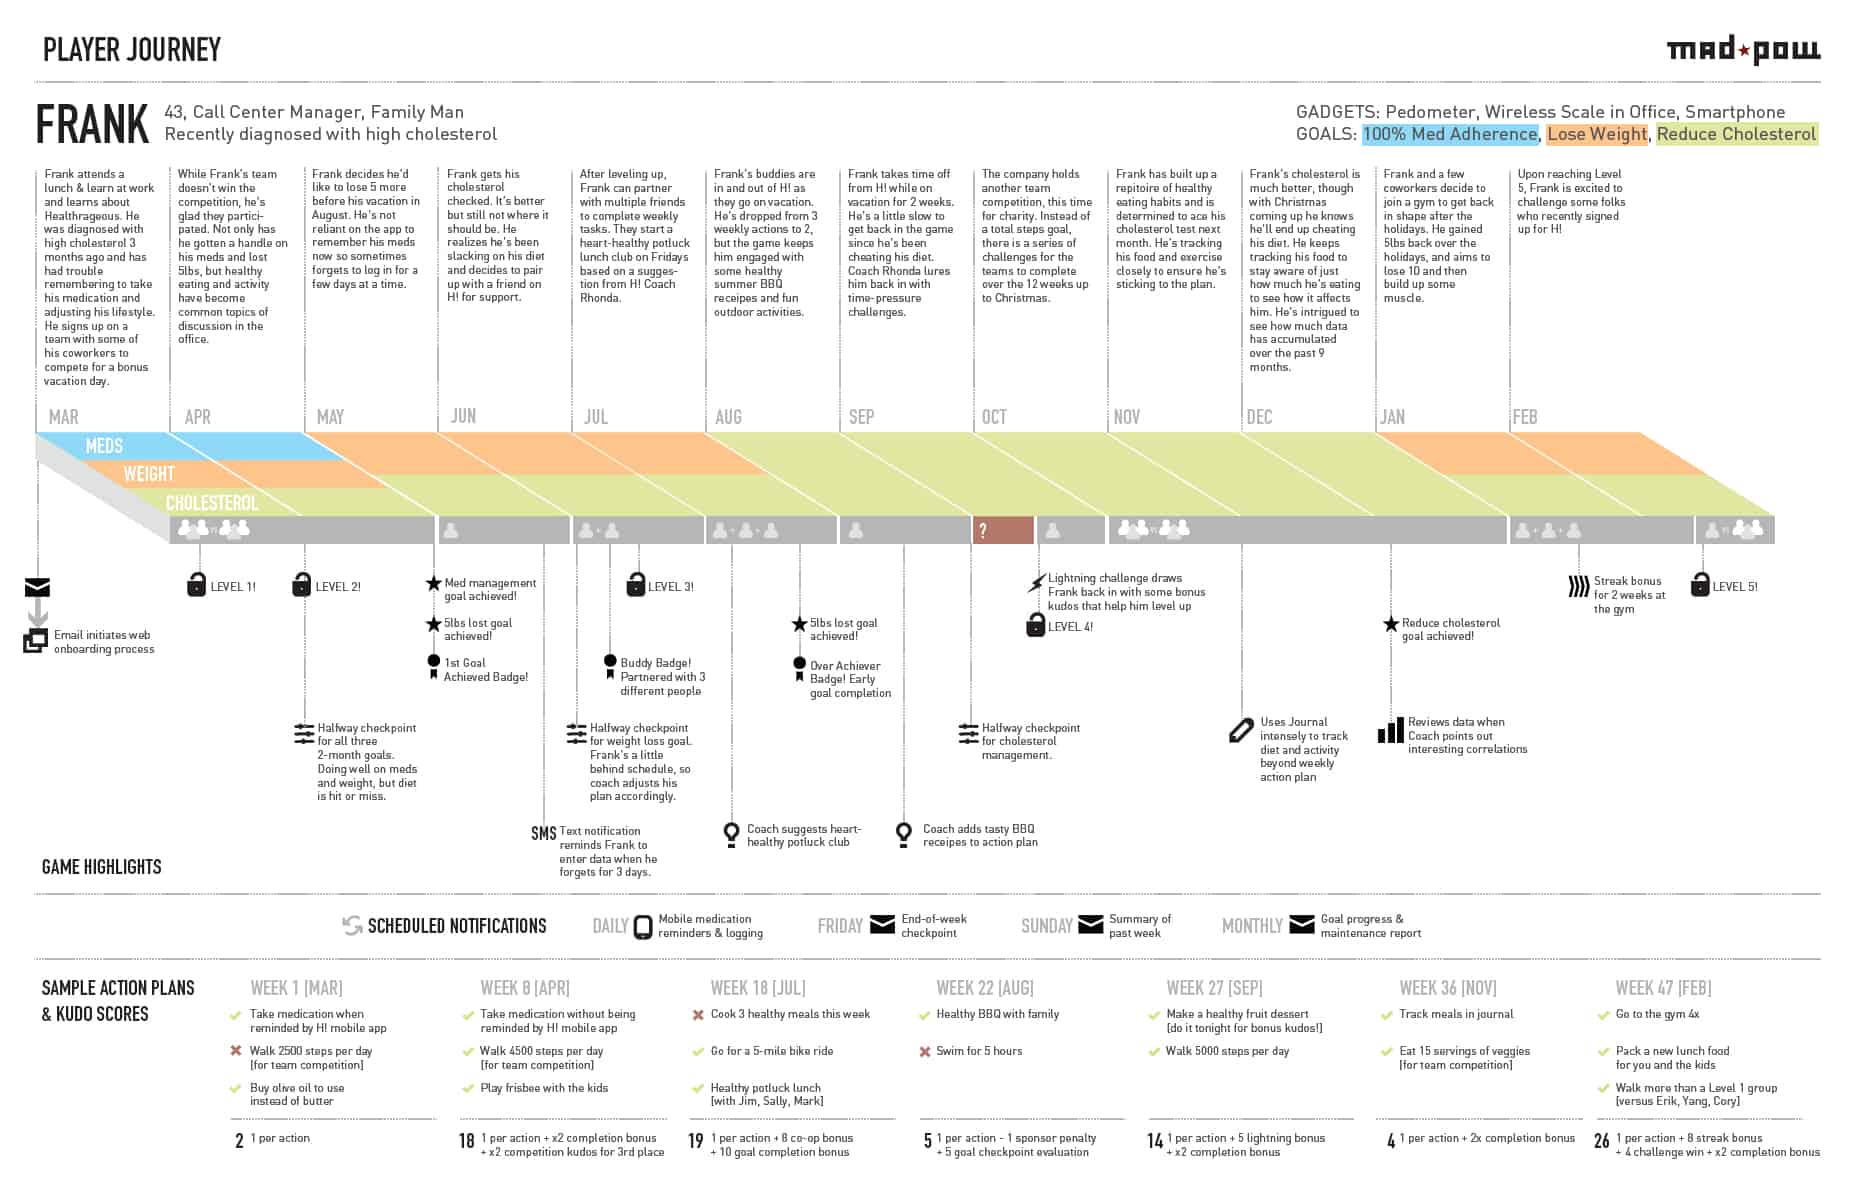
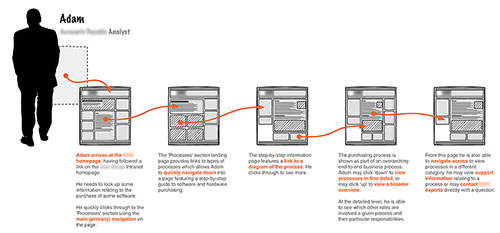
Usually journey maps are a tangible deliverable. View larger image
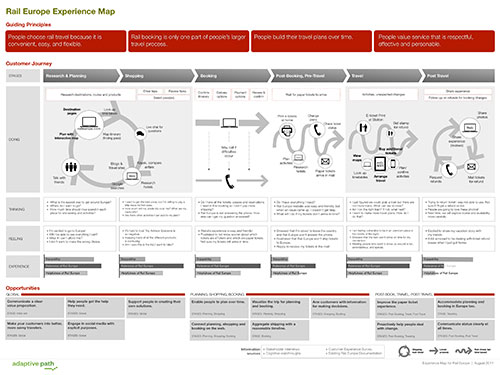
Rail Europe Experience Map by Adaptive Path. View larger image
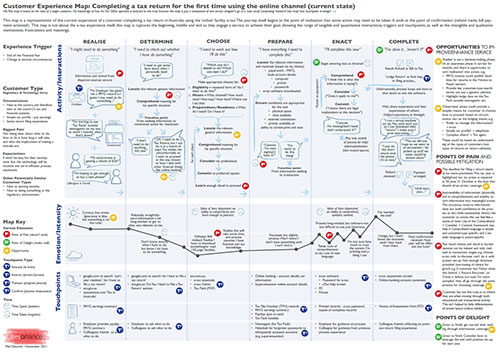
Customer Experience Map. View larger image (PDF)
A customer journey map by Andy Walker.
References


Great article and examples!
Hi Dana, thanks for your response. Always nice to hear when people like the article.